


Gold enters the new trading week following a sharp downside expansion through the $3,975 area and the broader $3,950–$3,960 support region. Price finished close to the weekly low, leaving the Daily, 4H and 1H structures under bearish pressure. However, the move is already extended. Lower-timeframe trend strength is easing, while the SRFX Elliott Wave model identifies the possibility of a corrective rebound. The preferred approach is to monitor a recovery into resistance and assess whether sellers regain control. Selling immediately into the lows offers a less favourable location and greater exposure to a relief bounce.

1. Market Structure: Broken Support Becomes Overhead Resistance
SRFXGLOBAL Technical Ideas | Prepared 1 November 2026
Session focus: Monday, 2 November 2026
Reference close: $3,875.645 | Latest weekly low: $3,870.320
Timeframes: Weekly, Daily and 4H context; 1H, 15m and 5m execution
The latest Daily candle recorded:
Open: $4,024.035
High: $4,026.550
Low: $3,870.320
Close: $3,875.645
The close was only approximately $5.33 above the low. This shows that the session ended near its weakest price rather than recovering meaningfully from the sell-off.
Gold is now below several previously important support references. The $3,950–$3,975 region becomes an overhead recovery hurdle, while $3,870 is the immediate downside decision level.
Price is also approaching a drawn rising support line visible on the broader charts. That creates a location where a reaction is possible, but a trendline touch alone does not establish a tradable reversal.
2. SRFX ADX PRO: Strong Bearish Pressure, Incomplete Entry Timing
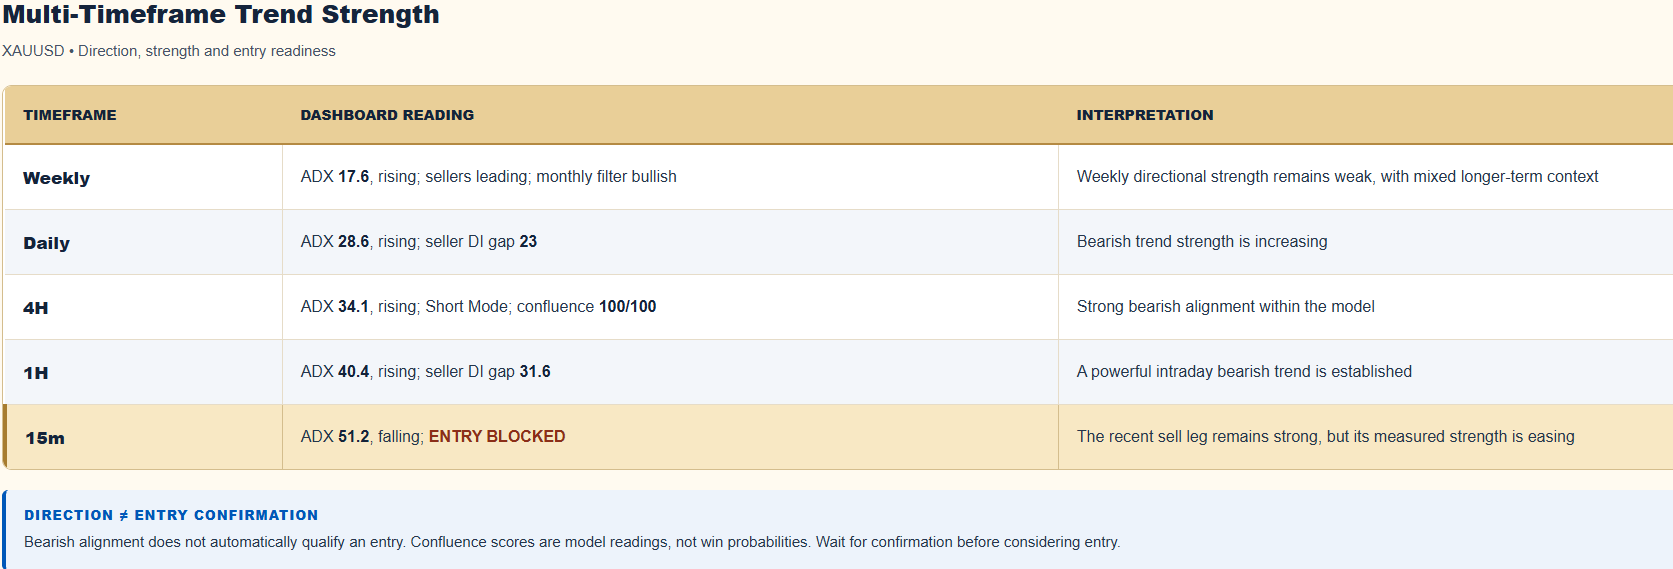
The distinction between direction and entry timing is essential.
Although the 4H and 1H setups show active bearish conditions, their signal rows remain WAIT and trade status remains FLAT. The 15m model explicitly blocks entry because ADX is falling.
A falling ADX does not itself signal a bullish reversal. It indicates weakening trend strength and supports waiting for either a renewed bearish impulse or a confirmed recovery structure.
Confluence scores are model readings, not probabilities of success.
3. SRFX CDV PRO and Footprint Pro: Sellers Lead, but Watch the Local Response
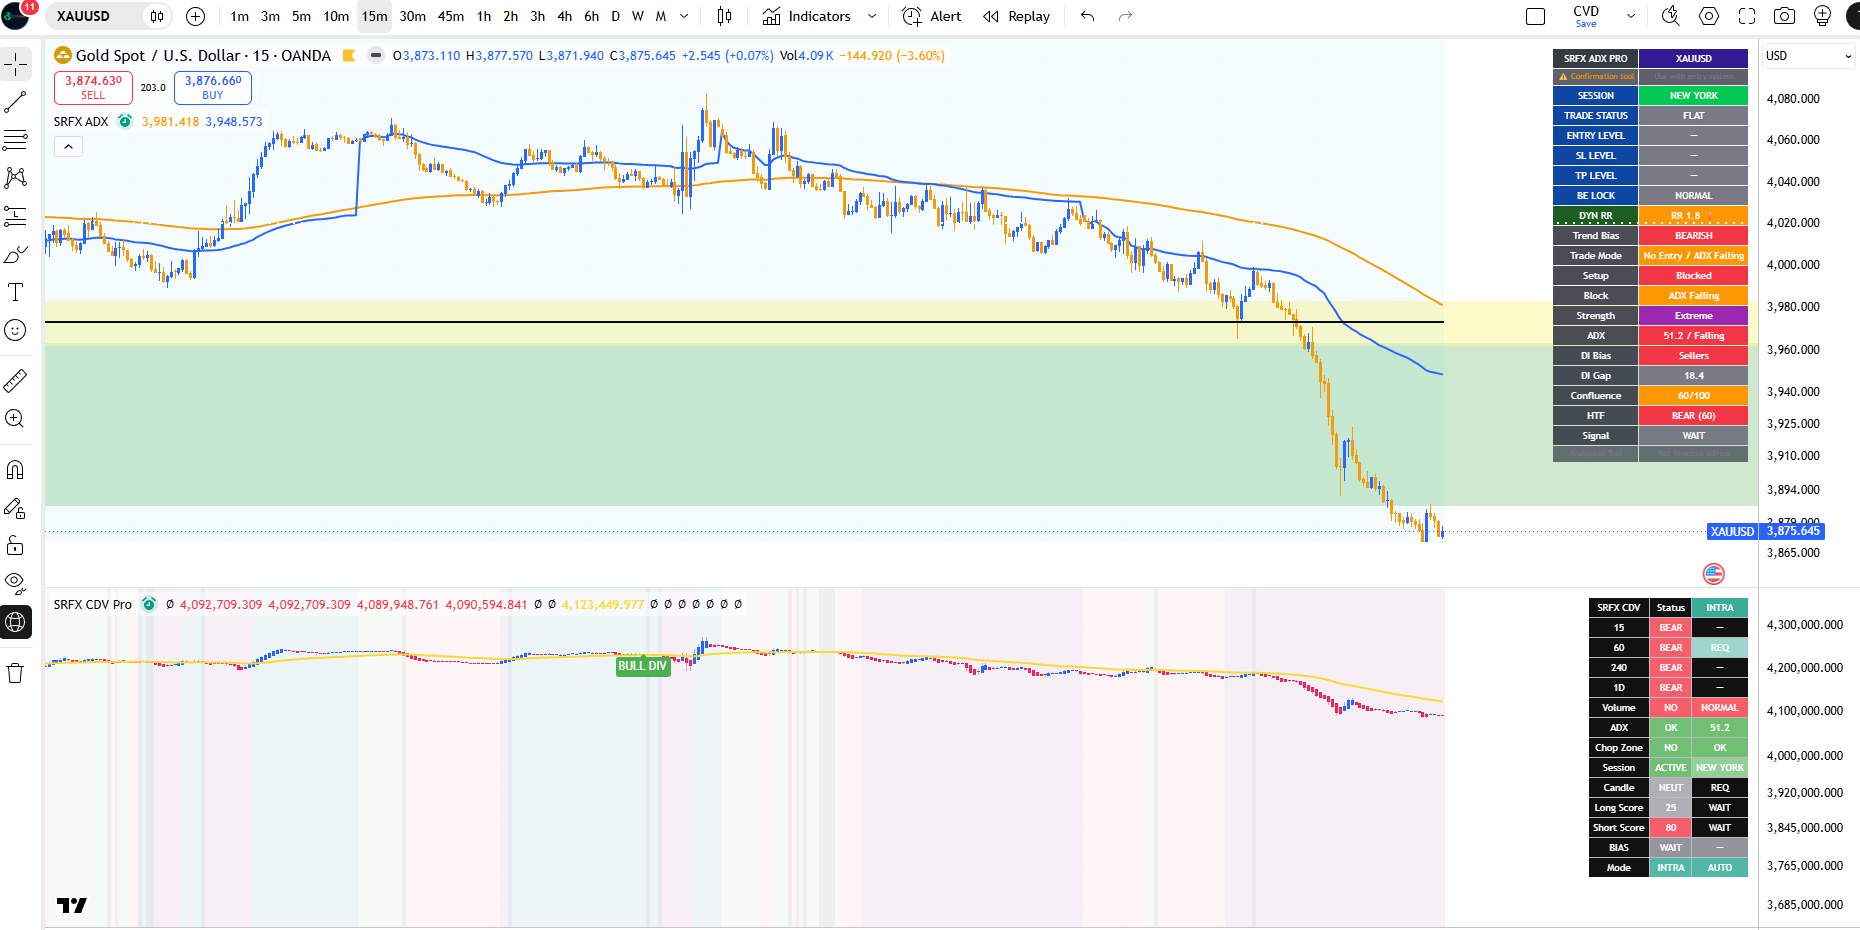
SRFX CDV Pro shows bearish status across the 15m, 1H, 4H and Daily timeframes. The 4H short score is 95, while the 1H short score is 80.
Footprint Pro broadly supports this bearish interpretation:
4H: Strong Bear, falling CVD, bar delta −13,050, and a bearish delta order-block flag.
1H: Bearish, falling CVD, bar delta −2,656.
30m: Bearish, with a STACK SELL imbalance flag.
15m: Neutral, with a BUY RETEST flag, despite falling CVD and slightly negative bar delta.
The 15m reading introduces a potential local response around the lows. It does not outweigh the higher-timeframe bearish structure or confirm sustained buying.
The nearest Footprint reference cluster lies around $3,879–$3,886, combining the 4H and 1H POC and value-area-high readings. Reclaiming this area would be an early sign that a rebound is developing.
4. SRFX AMT: Trading Below Value Does Not Automatically Mean Buy
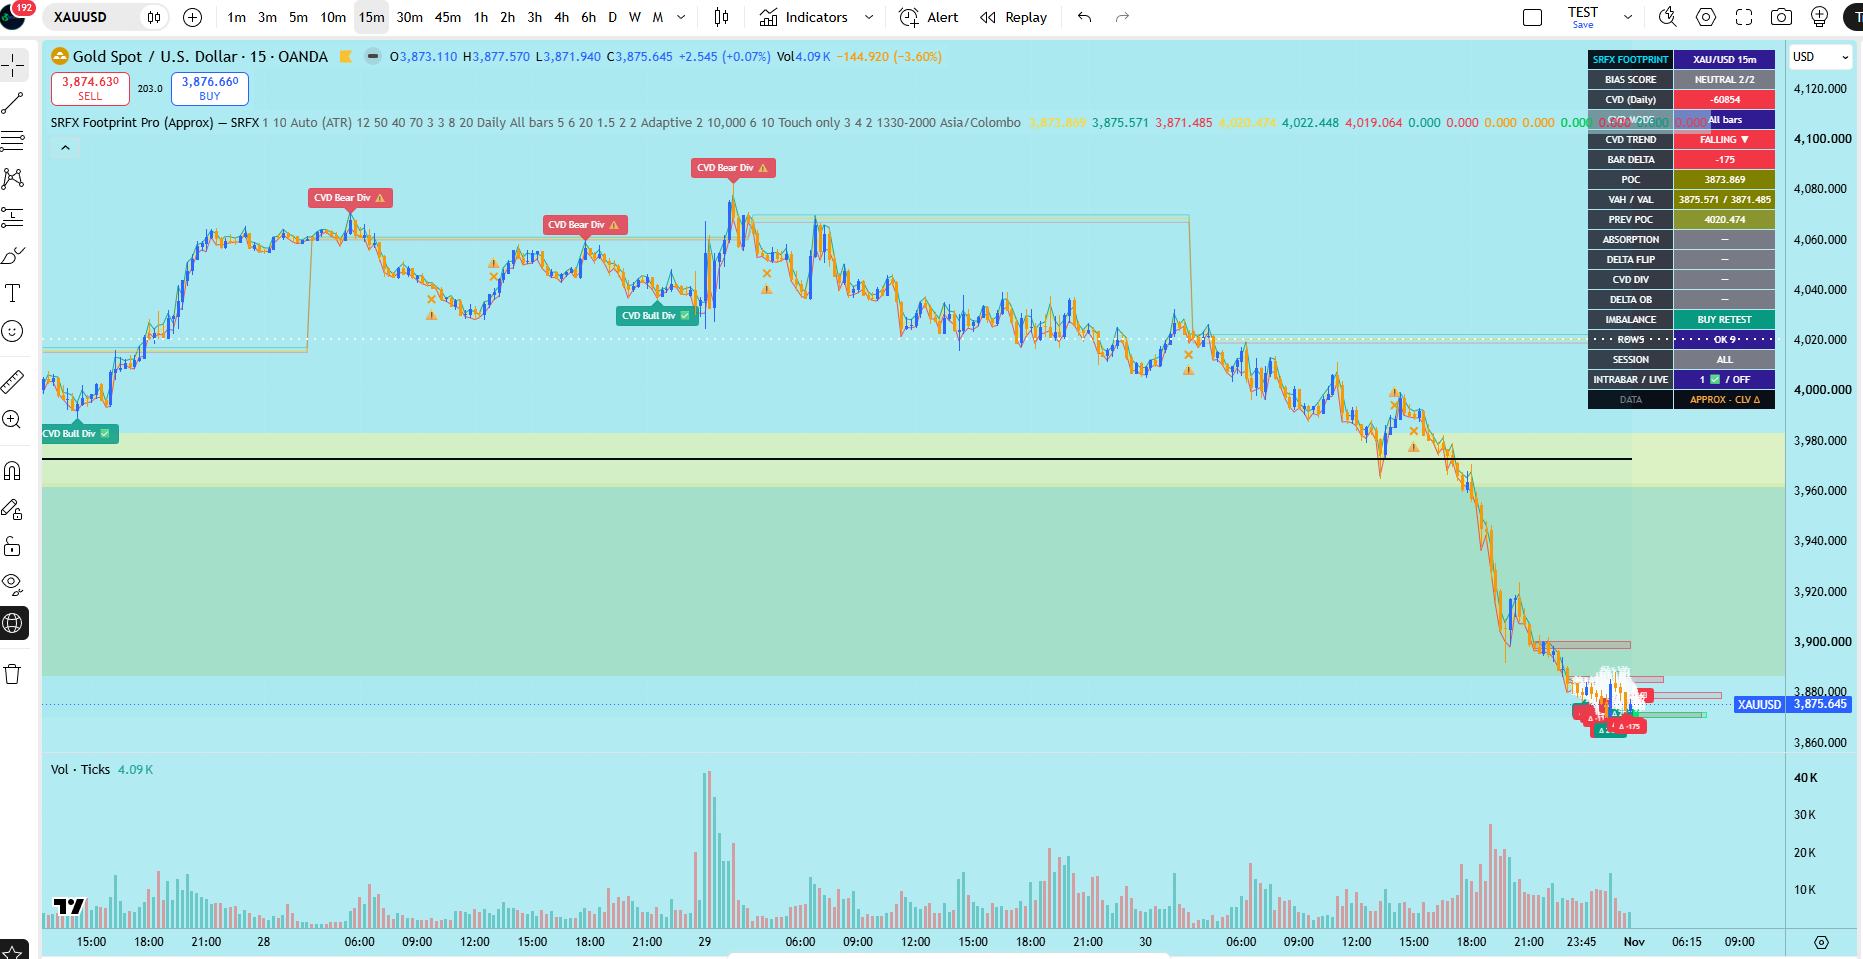
The 1H and 4H AMT dashboards classify price as DISCOUNT — Below Value, while their trend readings remain DOWN.
Their displayed lower value boundaries are approximately:
1H VAL: $3,906.8
4H VAL: $3,912.0
These references support monitoring $3,895–$3,912 as a potential recovery-and-rejection area.
Both dashboards display MODEL FLAT and an EMA Slope Conflict, despite readiness scores of 70/100. This is not a completed directional entry signal.
The profiles also use developing value calculations. Their levels can shift as new trading activity arrives, so they should be refreshed after the market opens.
5. SRFX Elliott Wave: A Corrective Bounce Within a Bearish Structure
The displayed 4H Elliott Wave model identifies W2 complete, with a projected W3 decline. However, it also states:
LATE — NO CHASE | ACTIONABLE: NO
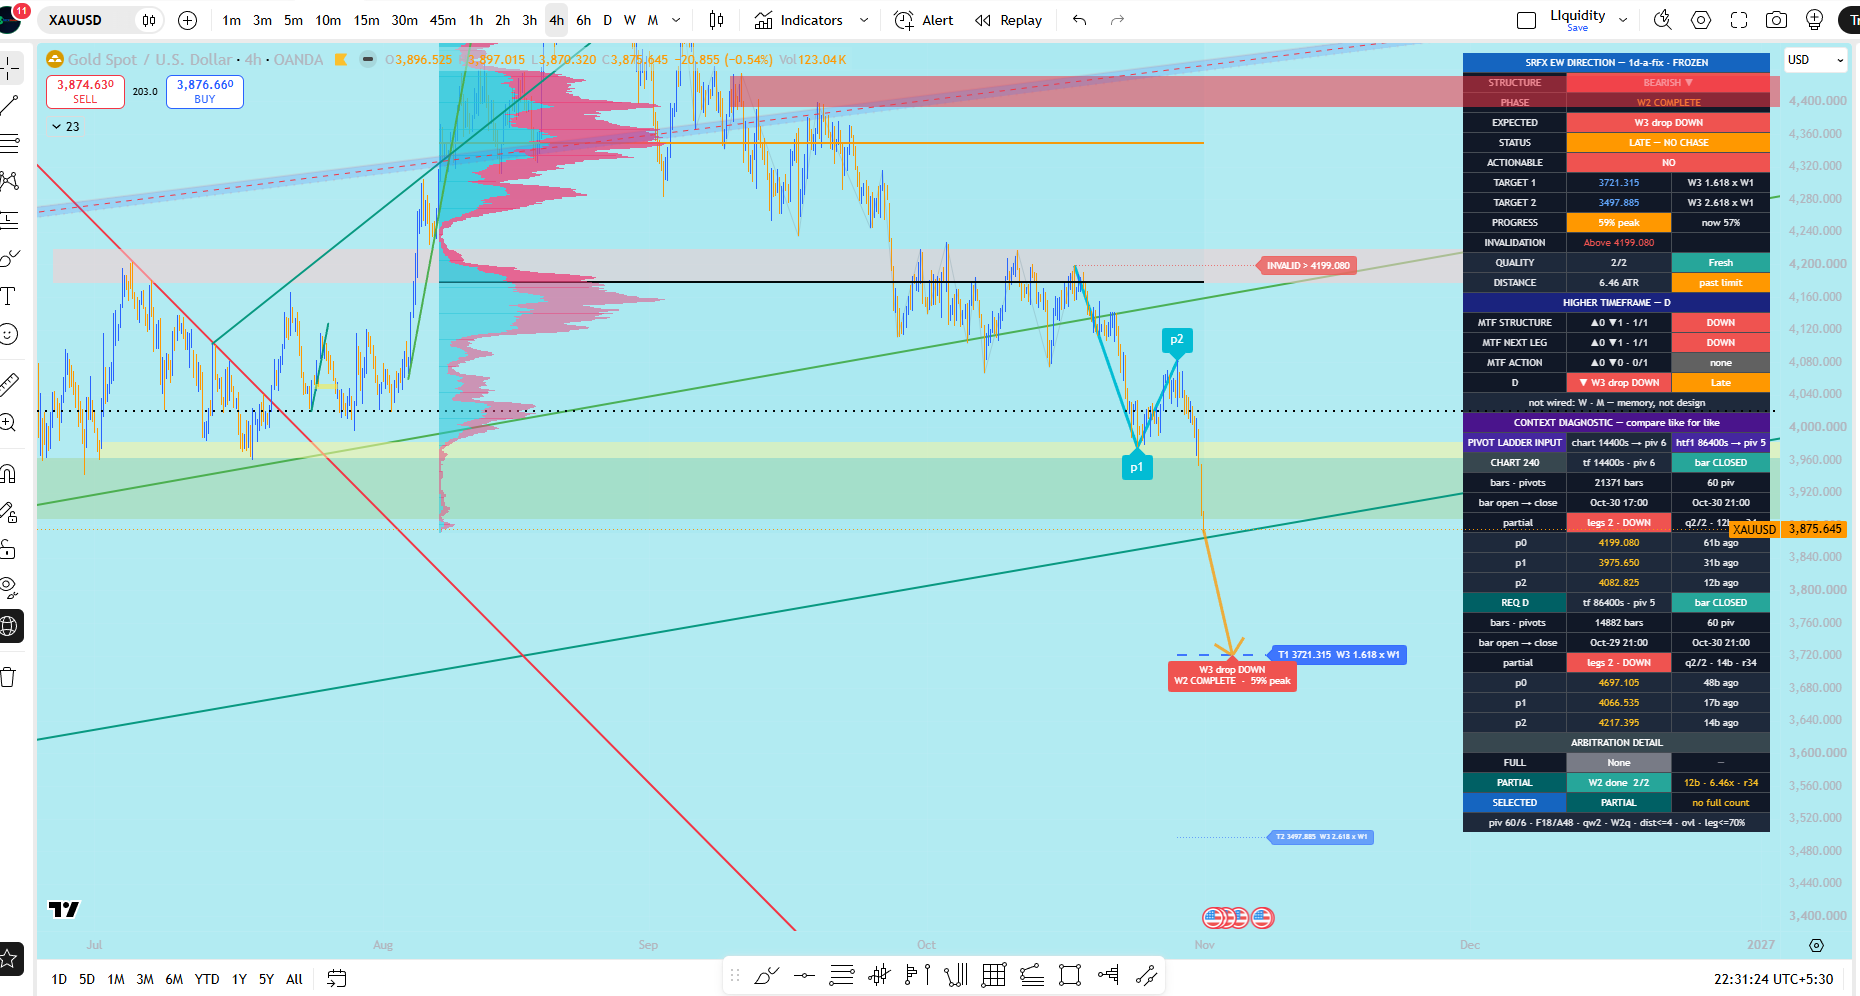
The displayed distance is 6.46 ATR, reinforcing the concern that price has already moved too far from the model’s reference area for a fresh entry under its rules.
On the 5m chart, the model identifies W5 complete and a potential Wave A recovery, with projections near:
$3,919.6
$3,950.1
The 5m quality score is only 1/4, so this is a tentative corrective scenario rather than strong reversal confirmation.
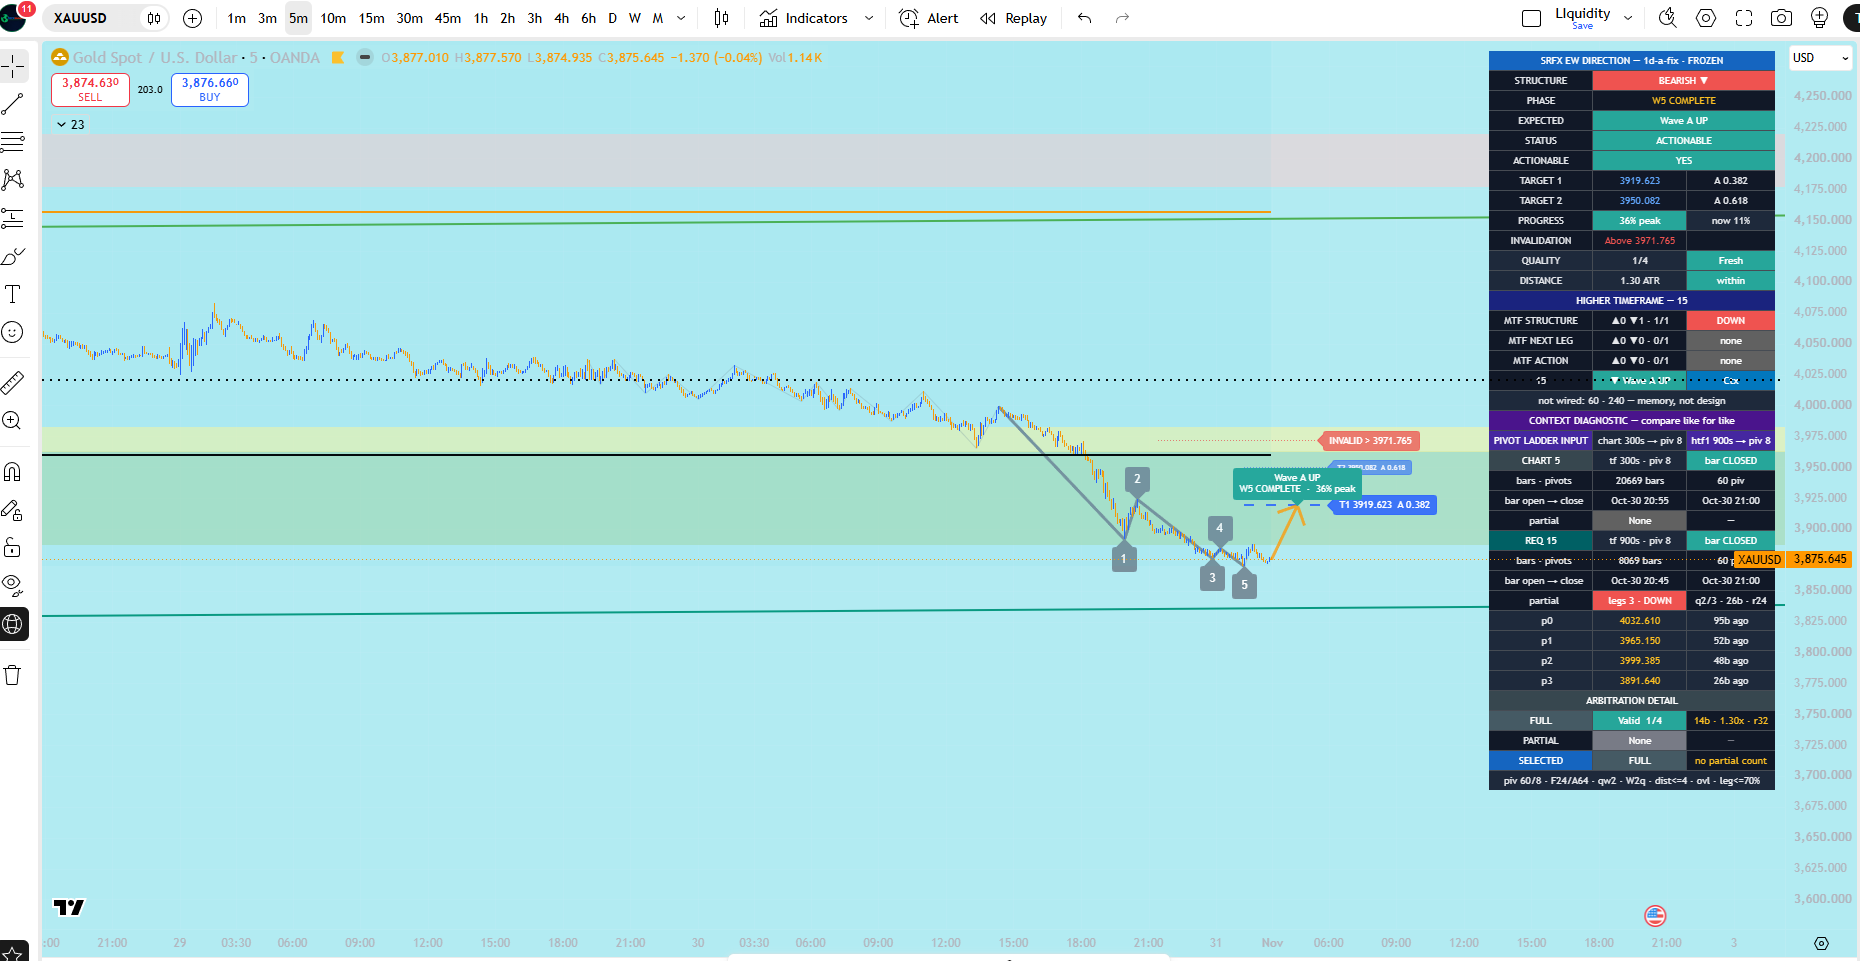
These readings can coexist: a short-term recovery may unfold inside a larger bearish trend. The displayed wave-count invalidation levels should not be substituted for trade-specific stop-loss levels.
6. Key Levels for the Opening Session
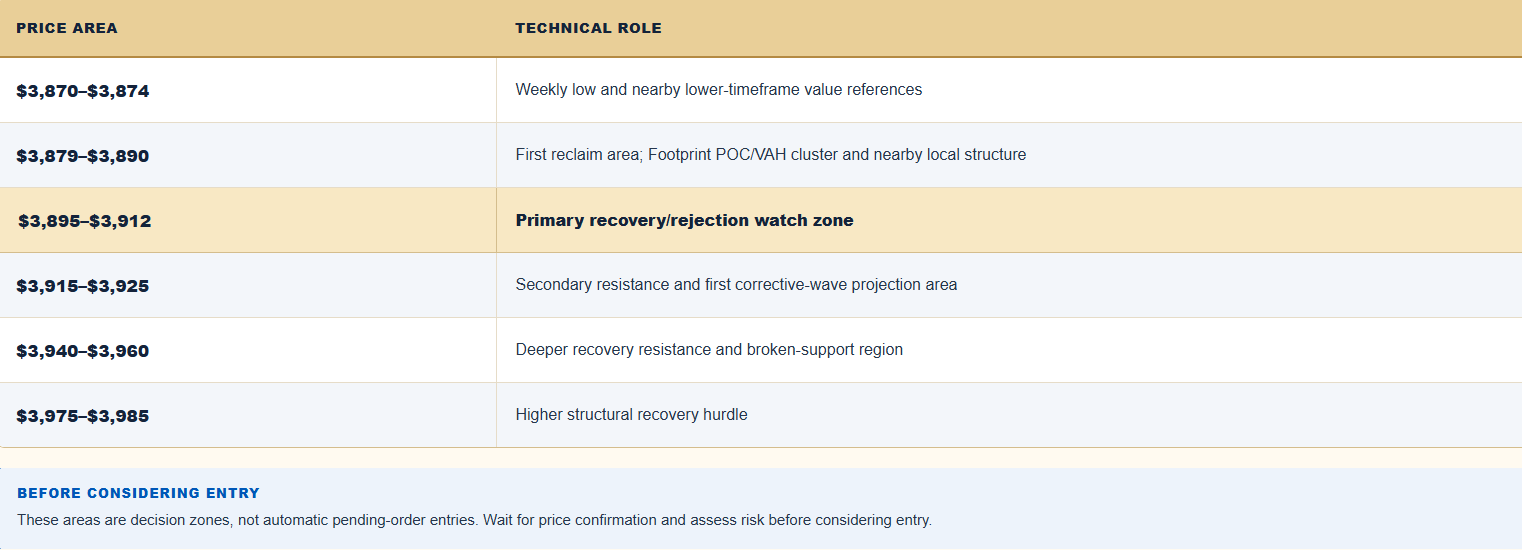
These areas are decision zones, not automatic pending-order entries.
7. Primary Scenario: Sell a Failed Recovery
The preferred bearish setup is a rebound into $3,895–$3,912, followed by evidence that buyers cannot sustain the recovery.
Before considering entry, look for:
A clear 5m/15m lower high or bearish rejection.
A subsequent close below the local support formed during the rebound.
Renewed negative delta/CDV pressure.
Rising execution-timeframe ADX with sellers retaining directional control.
Initial downside references:
$3,886 → $3,875–$3,870
A sustained break below $3,870, followed by a failed reclaim, would support a continuation scenario toward $3,850 and potentially $3,805–$3,840. These lower areas are approximate round-number and drawn-support references, not confirmed demand zones.
A stop-loss should be placed beyond the confirmed rejection swing, allowing for spread and volatility. If the distance to nearby support does not justify the risk, the trade should be skipped.
Scenario failure: Acceptance above $3,912 weakens the first rejection setup. A 1H close above $3,925 followed by a successful hold would favour reassessing the immediate bearish entry thesis and monitoring a deeper recovery toward $3,940–$3,960.
8. Alternative Scenario: A Confirmed Relief Bounce
A counter-trend recovery becomes more credible if price:
Holds $3,870, or sweeps below it and promptly reclaims it.
Closes above $3,886–$3,890 on the 15m chart.
Retests the reclaimed area successfully.
Develops improving bullish delta/CDV and a higher-low structure.
The next recovery references would be $3,900–$3,912, followed by $3,919–$3,925.
A move toward $3,950 would require further confirmation through intermediate resistance. Failure to hold the reclaimed support or a break of the new reversal swing low would undermine the bounce setup.
Opening-Session Approach
The first question is whether gold holds $3,870 and reclaims $3,886–$3,890, or accepts below $3,870.
Allow the opening spread and initial price structure to stabilise. If a substantial gap changes the market’s location, rebuild the plan around the new opening range rather than applying Friday’s levels mechanically.
SRFX Positioning: Bearish higher-timeframe bias, with a potential corrective bounce. Prioritise confirmed rejection setups over chasing an extended decline.
The SRFX framework combines trend strength, volume-pressure estimates, auction location and wave context to distinguish directional opportunity from entry readiness.
Methodology: Footprint Pro uses approximate CLV-based delta rather than verified exchange bid/ask executions. Indicator scores are not win probabilities. The tools share underlying price and volume inputs and should be treated as complementary analysis.
Risk disclosure: This outlook reflects conditions at the stated preparation time and is educational, not a personalised investment recommendation. Weekend gaps, changing spreads and slippage can affect execution. Use defined stops and appropriate position sizing; no scenario or target is guaranteed.
SRFXGLOBAL | Structure. Confirmation. Risk Control.


