


SRFXGLOBAL | 29 October 2026 | 15:08 SLST Reference price: approximately $4,024 Gold retains a bearish higher-timeframe structure while testing an important intraday support area. The SRFX indicator suite shows selling pressure across multiple timeframes, but weak short-term trend strength and an emerging buying response favour patience before initiating fresh positions. The preferred scenario is a failed recovery into resistance. A confirmed support reclaim would instead open the door to a counter-trend bounce.

Gold retains a bearish higher-timeframe structure while testing an important intraday support area. The SRFX indicator suite shows selling pressure across multiple timeframes, but weak short-term trend strength and an emerging buying response favour patience before initiating fresh positions.
The preferred scenario is a failed recovery into resistance. A confirmed support reclaim would instead open the door to a counter-trend bounce.
SRFX ADX PRO: Bearish Direction, Mixed Trend Strength
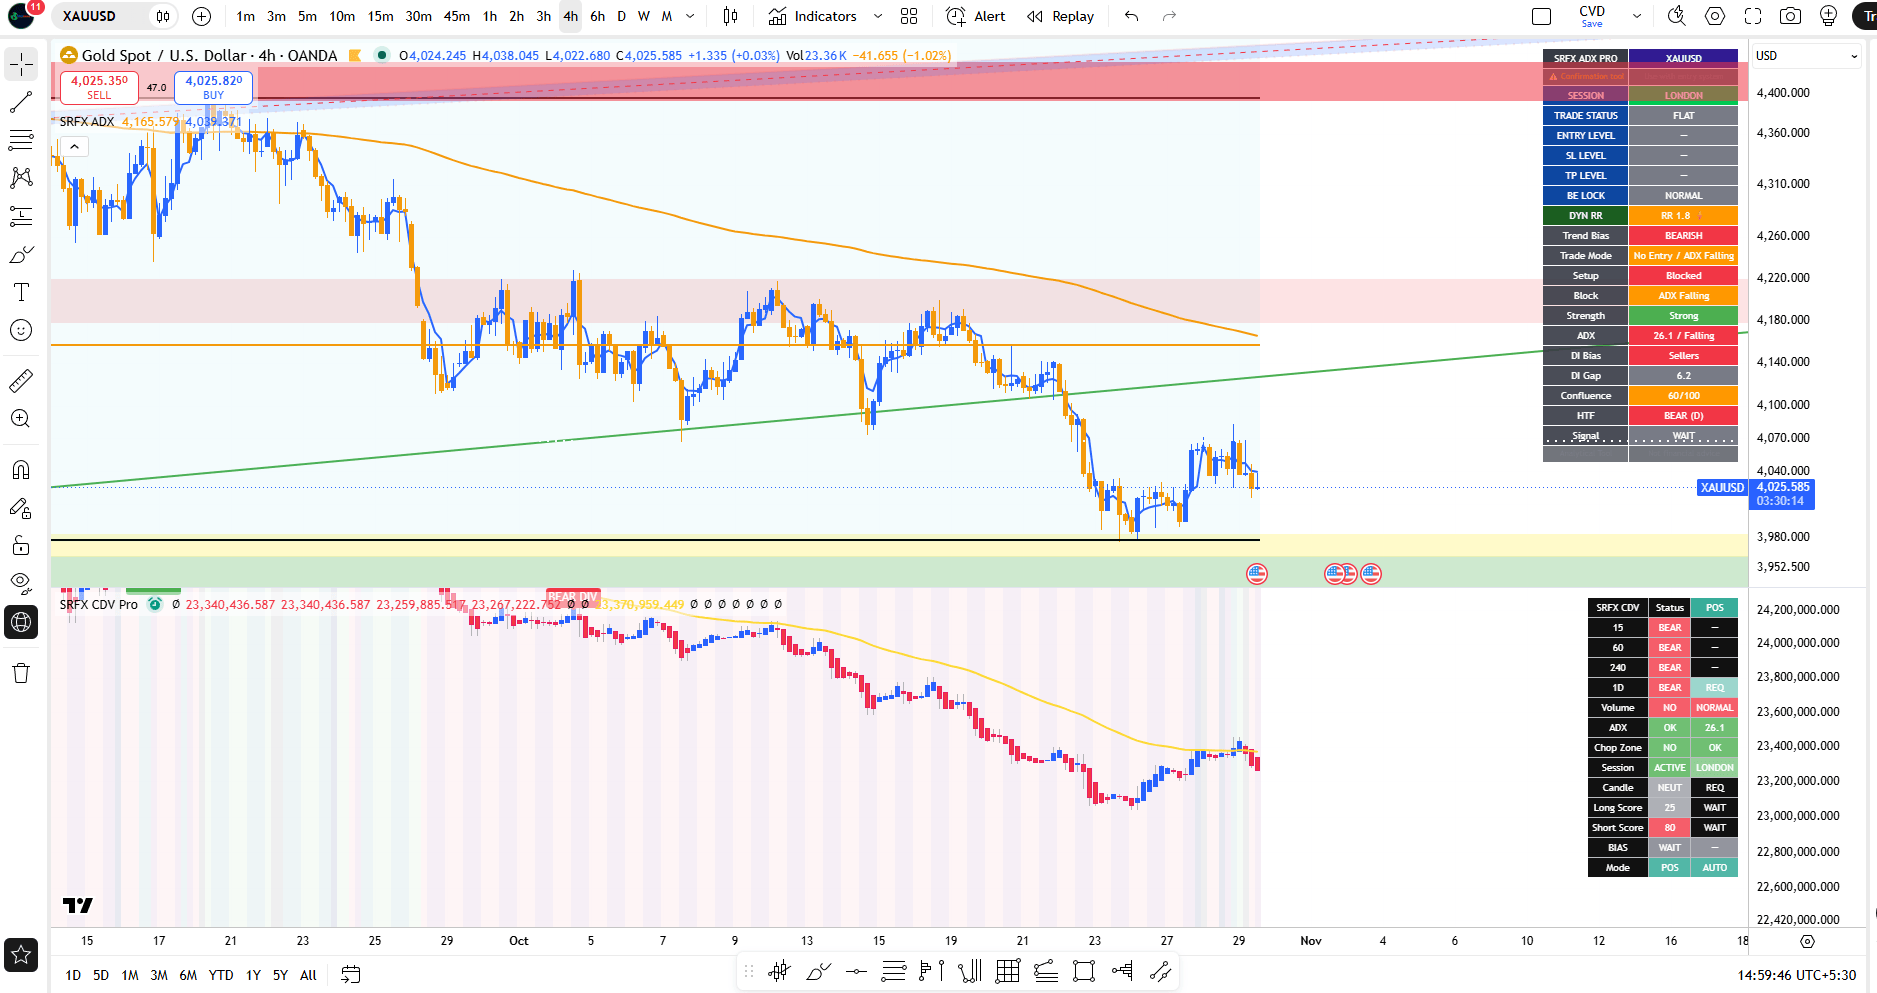
Daily ADX stands at 26.8 and rising, with sellers leading. On the 4H chart, ADX remains elevated at 26.1, but its downward slope indicates weakening trend strength.
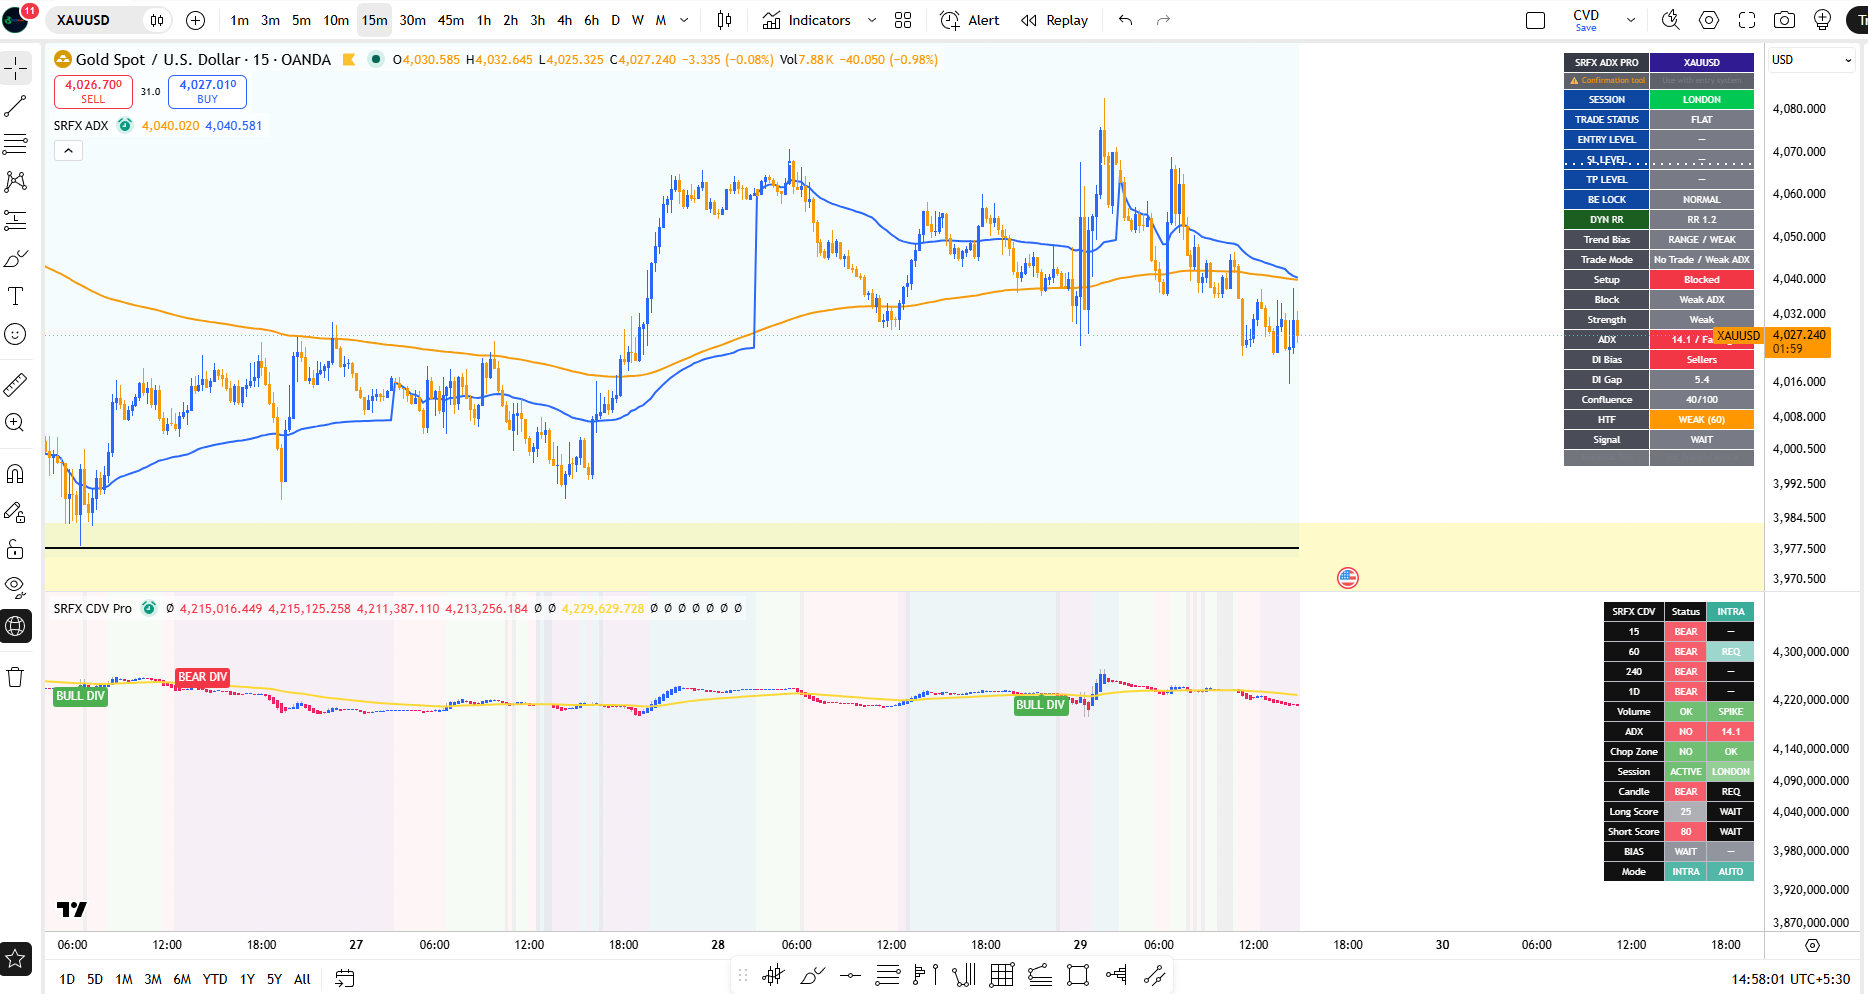
The 1H and 15m readings are 17.2 and 14.1, respectively. These lower readings suggest that intraday price action lacks a strong directional trend.
The distinction matters: the broader bearish bias remains relevant, while the execution-timeframe dashboards continue to display WAIT / BLOCKED. Directional bias alone does not provide a complete entry setup.
SRFX CDV PRO: Bearish Alignment Across Timeframes
CDV status remains bearish across the 15m, 1H, 4H and Daily timeframes. A recent 1H bearish divergence adds caution to upside recovery attempts.
Short scores of 70–80 reflect bearish conditions within the indicator’s scoring model. They are not win probabilities, and the remaining entry filters still require confirmation.
SRFX FOOTPRINT PRO: Buyers Attempt to Respond
Footprint bias is NEUTRAL. Daily cumulative delta remains negative, but the CVD trend is rising and current-bar delta is positive.
This combination suggests a recovery attempt within the broader bearish structure. Whether that attempt develops into a sustained bounce depends on price reclaiming nearby value levels.
Key references include:
$4,027–$4,029: Current POC cluster.
$4,035: Approximate 1H/4H value-area high.
$4,040–$4,050: Nearby overhead resistance.
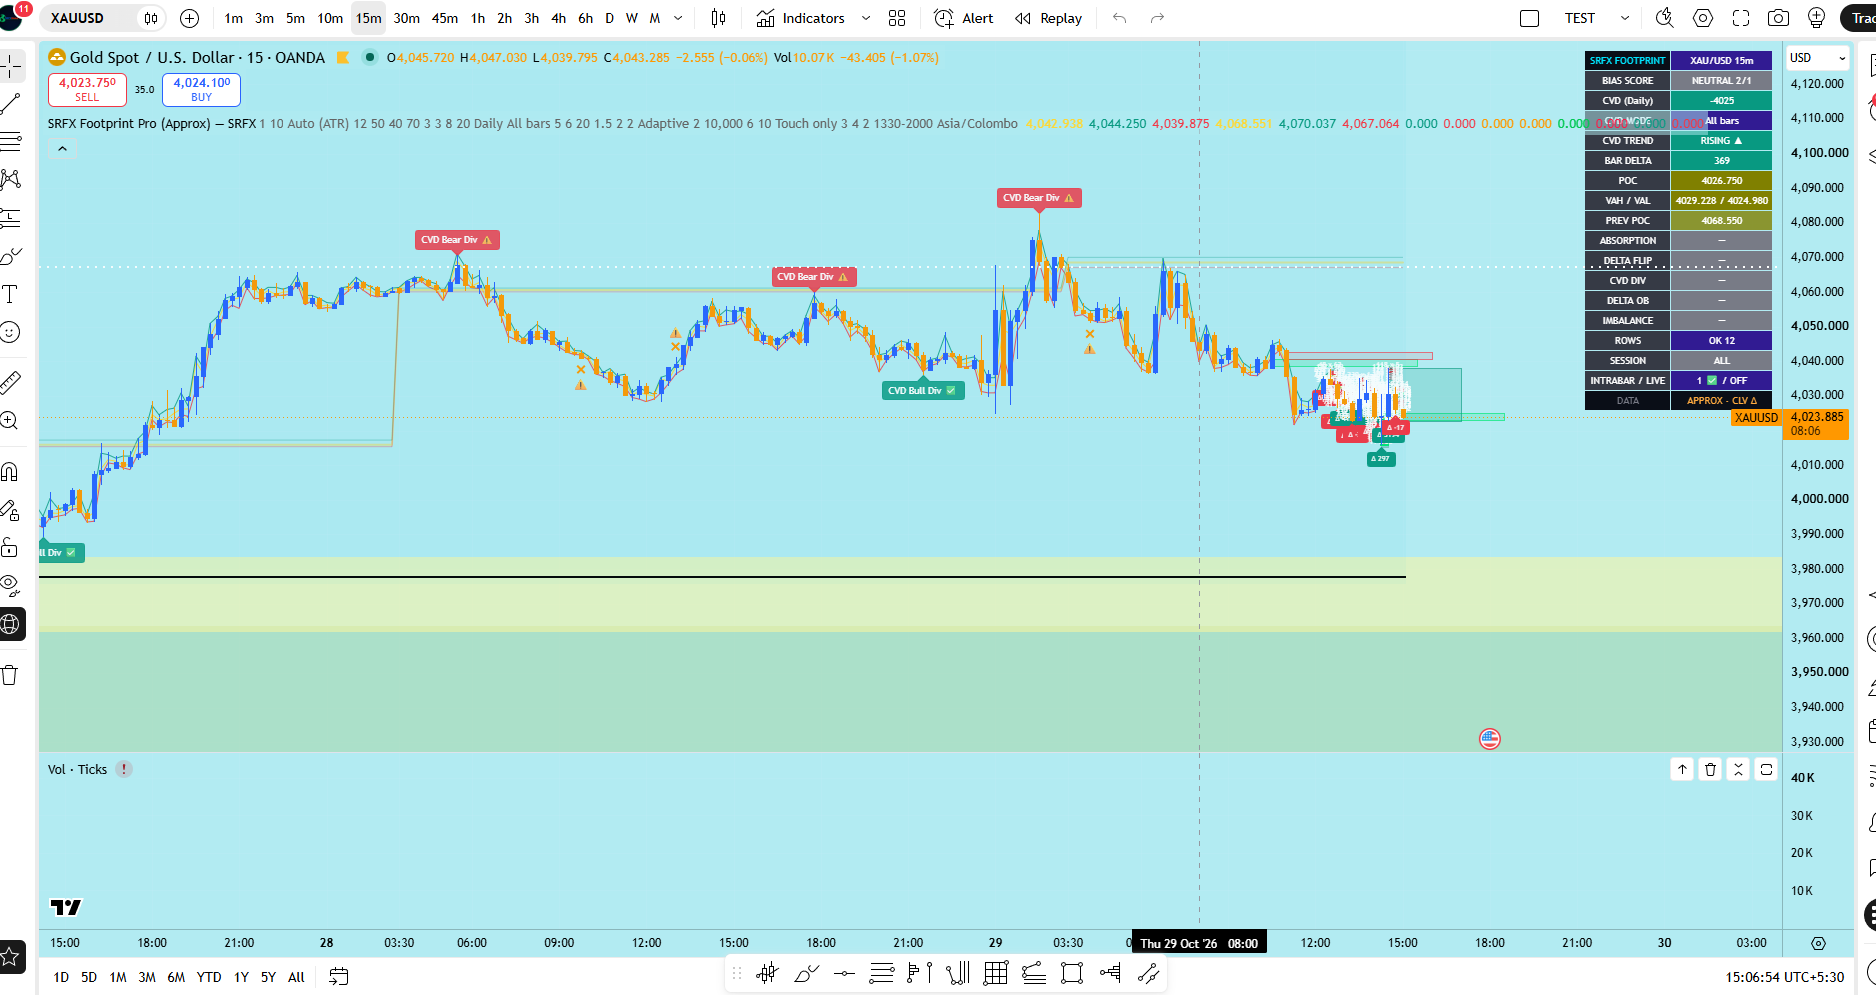
Acceptance above these levels would strengthen the recovery case. Positive delta without sustained upward price progress would leave the bounce vulnerable to renewed selling.
The dashboard does not currently flag confirmed absorption or an imbalance.
SRFX WYCKOFF: Potential Support Retest, Limited Bullish Confirmation
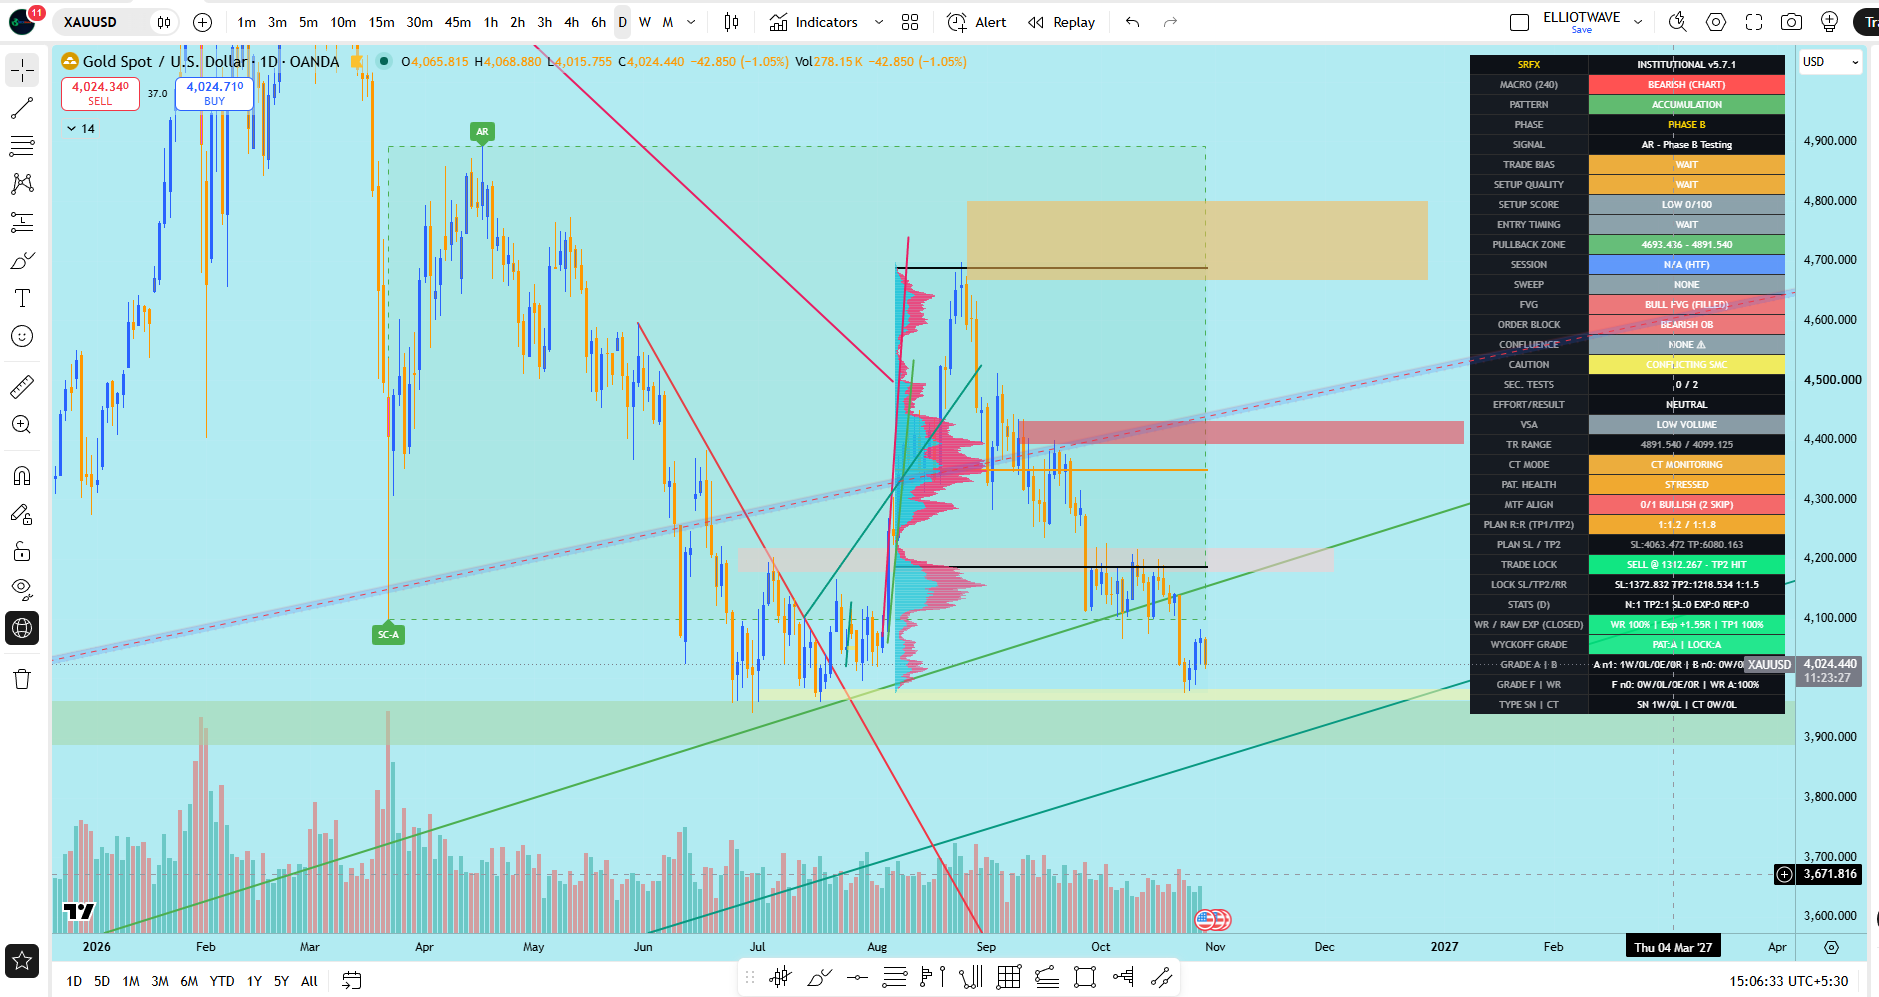
The 1H model identifies a potential accumulation/LPS retest around $4,016–$4,030. However, its setup score is 22/100, accompanied by a COUNTER-TREND BUY warning and 0/3 bullish multi-timeframe alignment.
The 4H model displays NO TRADE / INVALID / WAIT NEW, reinforcing the absence of a confirmed higher-timeframe bullish setup.
The current area is therefore a location to monitor for a buying response, rather than confirmation that a broader reversal has started.
Primary Scenario: Sell a Failed Recovery
The principal resistance area to monitor is $4,035–$4,050.
A potential short setup requires a bearish rejection followed by a break of local 15m support, renewed bearish delta/CDV and rising ADX with sellers maintaining directional control. Relevant entry filters should clear before execution.
Conditional downside references are:
$4,025 → $4,016 → $4,000–$3,995 → $3,985–$3,978
These are reaction areas, not guaranteed targets. A stop-loss should sit beyond the confirmed rejection structure, with sufficient allowance for volatility. If nearby support leaves inadequate reward relative to risk, the setup should be skipped.
Continuation Scenario: Support Breaks
A 15m close below $4,016, followed by a failed reclaim of $4,016–$4,024, would weaken the bullish retest scenario.
With renewed bearish confirmation, this could favour a move toward $4,000–$3,995, followed by $3,985–$3,978.
A brief wick below support is insufficient. Sustained trading below the level and a failed retest provide stronger evidence of a breakdown.
Alternative Scenario: Support Holds
If $4,016 holds and price reclaims $4,029–$4,035, a successful retest with improving momentum would support a counter-trend recovery toward $4,040–$4,050.
Sustained acceptance above $4,050 would weaken the immediate rejection-short thesis and bring $4,060–$4,080 into focus. A stronger structural shift would require further confirmation beyond that resistance area.
Current Stance: Bearish Bias — Await Entry Confirmation
The immediate decision area lies between $4,016 support and $4,035 resistance. A failed recovery offers the preferred bearish scenario, while a confirmed reclaim would require reassessing the short-term outlook.
The SRFX framework brings together trend strength, volume-pressure estimates, price location and market structure to define conditional opportunities—and identify when conditions favour waiting.
Methodology: SRFX Footprint Pro uses approximate CLV-based delta rather than verified exchange bid/ask executions. Indicator readings can change before candle close. The indicators share underlying market data and should be assessed as complementary tools rather than independent proof.
Risk disclosure: This technical outlook reflects conditions at the stated analysis time and is provided for educational purposes, not as a personalised investment recommendation. Leveraged trading carries substantial risk. Use a defined stop-loss, appropriate position sizing and a favourable reward-to-risk profile. No outcome is guaranteed.
SRFXGLOBAL | Structure. Confirmation. Risk Control.


