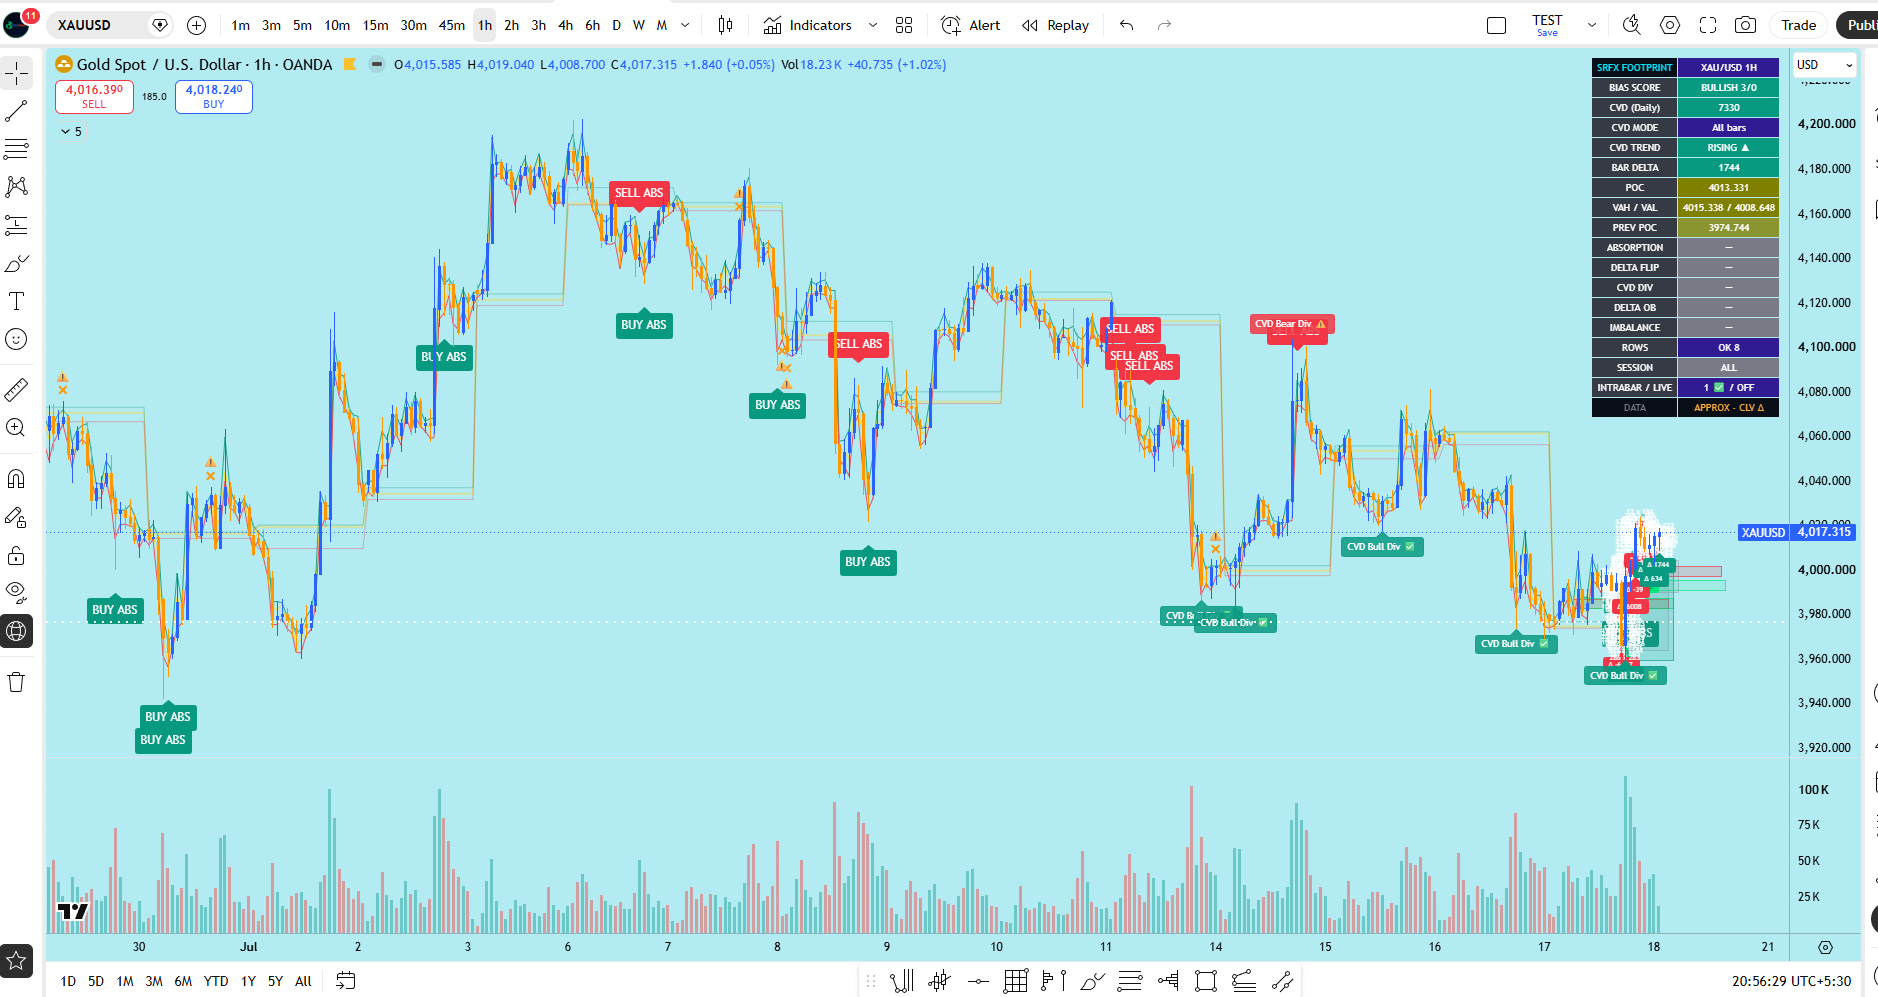
Description:

PURPOSE / METHODOLOGY

Many spot and forex symbols, including gold, do not provide true exchange bid/ask footprint data on TradingView. This tool approaches that limitation by building an estimated per-price-level volume-and-delta model from lower-timeframe candles.


The script uses request.security_lower_tf() to pull lower-timeframe candles, such as 1-minute candles, distributes each candle’s volume across the price levels it traded through, and estimates the buy/sell split using the close-location method. This means volume is not simply placed at the candle close; it is distributed across the candle’s high-low range to create an approximate volume-at-price view.


All major components are derived from this reconstructed dataset, so the tool behaves as a single coherent order-flow reading workspace rather than a stack of unrelated indicators.


HOW THE COMPONENTS WORK TOGETHER

The footprint grid shows where estimated volume traded inside each bar, displayed as estimated Sell x Buy volume per price row.


The POC and contiguous Value Area highlight where the largest portion of volume was concentrated inside the bar.
Diagonal imbalances and stacked imbalance zones highlight price levels where one side appears dominant relative to the opposite side, based on the estimated delta model.


Session-reset Cumulative Delta (CVD) and price/CVD divergence help show whether net pressure is confirming or contradicting price movement.


Absorption markers highlight high-volume bars where price rejects against its own estimated delta pressure.
Adaptive delta Order Blocks mark bars where estimated delta is unusually large compared with its own recent average, allowing the threshold to adapt across symbols and timeframes instead of relying on one fixed number.
Read together, the footprint grid shows the level, imbalances and absorption show estimated pressure at that level, and CVD/divergence show whether the move is supported or weakening.


HONEST DATA NOTE

TradingView does not provide true bid/ask aggressor data for many symbols. Delta in this script is estimated using lower-timeframe candle volume and close-location logic. On instruments such as spot gold, the underlying volume may be tick volume. This is an approximate footprint / delta volume profile for analysis and education. It is not a true exchange bid/ask footprint and should not be treated as one.


HOW TO USE

This tool is best used on intraday charts such as 3m, 5m, 15m, and 1H. Higher timeframes may compress the footprint grid.


Set the Intrabar Timeframe lower than the chart timeframe. A 1-minute intrabar setting is commonly used. The dashboard confirms whether intrabar data is available.
Use POC and Value Area as reference zones, imbalances and stacked zones as estimated aggressive-activity areas, absorption as a possible rejection clue, and CVD divergence as possible exhaustion or confirmation context.
This is a discretionary analysis tool, not an automatic signal system. It should be combined with market structure, context, risk management, and the trader’s own decision process.


SETTINGS

The script includes settings for footprint bars, row sizing using Auto ATR or manual ticks, value-area percentage, imbalance ratio, stacked imbalance minimum, CVD reset anchor, divergence sensitivity, absorption, adaptive delta order-block zones, optional session filtering, and optional live forming-bar footprint.


The live forming-bar footprint is off by default. When enabled, only the current unclosed bar updates in real time; confirmed historical bars do not change.


DISCLAIMER

This is an original analytical and educational tool. It does not predict price, does not guarantee results, and does not provide financial advice. Always do your own research and manage risk.


v1.1 — Built-in alert suite


Added a full set of alerts so you no longer need to watch the chart to
catch a footprint event. Every alert evaluates on confirmed bars only,
so there is no repainting — when creating an alert, choose "Once Per Bar
Close".


New alerts (12):

  • Bull Absorption / Bear Absorption
  • CVD Bull Divergence / CVD Bear Divergence
  • Bull Delta Order Block / Bear Delta Order Block
  • Stacked Buy Imbalance / Stacked Sell Imbalance
  • Up-Move Exhaustion / Down-Move Exhaustion
  • Any Bullish Signal / Any Bearish Signal (combined, one-alert option)


The underlying footprint, volume profile, POC, Value Area, imbalances,
CVD and dashboard are unchanged — this update only exposes the existing
signals as alerts.

SRFX Footprint Pro (Approx)

Access for a Month
:
$19.00
Access for a Year
:
$125.00
SRFX Footprint Pro reconstructs an approximate order-flow footprint / delta volume profile for markets where TradingView does not provide native bid/ask footprint data. It is designed as one integrated discretionary-reading workspace for volume, estimated delta, value-area context, imbalances, absorption, and CVD behavior.